One of the most predominant principles of international trade is the comparative advantage theory, developed by the British economist David Ricardo in the early 19th century. To put it simply, the theory argues that a country can boost its welfare if it specializes in certain products in which it has comparably lower cost of production (in other words, lower opportunity cost) and then trade with others. Keeping this principle in mind, one may wonder, in which products Azerbaijan can have comparative advantage and how can we use that to maximize our national well-being?
One uncomplicated way to calculate comparative advantage is using the method developed by Bela Balassa and Marcus Noland, which is called Revealed Comparative Advantage (RCA). The index can be obtained using the formula below:

In this formula, X means exports, i is the country of interest (in our case, Azerbaijan, Turkey and Georgia respectively), j is the product category, t is all product categories, and n is set of countries (all countries of the world). Thus, for example, this index calculates the share of product j in Azerbaijan’s overall exports divided by the share of product j in total exports of the World.
Using the above-mentioned formula, I have calculated the indices for Azerbaijan, Georgia and Turkey on 30 different product categories for the year of 2016. I later expanded the results by calculating the same indexes for 2012, 2008, 2004 and 2000 in order to see how they have evolved over the course of 16 years.
For obvious reasons, I will not be able to interpret all of the indexes here, since there are 450 of them. Rather, I selected the 10 most intriguing categories and decided to focus on those only. On the table below, you can see the selected range of product categories that I have inspected with their respective codes (from the Harmonized System of World Customs Organization).
Table 1: Selected Product Categories with their respective codes
| Code | Product Categories |
| 8 | Fruits and nuts, edible; peel of citrus fruit or melons |
| 17 | Sugars and Sugar Confectionery |
| 22 | Beverages, Spirits and Vinegar |
| 24 | Tobacco and Manufactured Tobacco Substitutes |
| 25 | Salt; Sulphur; Earths; Stone; Plastering Materials; Lime and Cement |
| 27 | Mineral Fuels, Mineral Oils and Products of Their Distillation…. |
| 39 | Plastics and Articles thereof |
| 52 | Cotton |
| 61 | Apparel and Clothing Accessories; Knitted or Crocheted |
| 76 | Aluminum and articles thereof |
Source: World Customs Organization
On the following graph, you can see the calculated RCA indexes for our countries of interest in 7 different product categories (the numbers on the horizontal axis is the code of the respective category).
Graph 1: RCA Indexes for the year of 2016
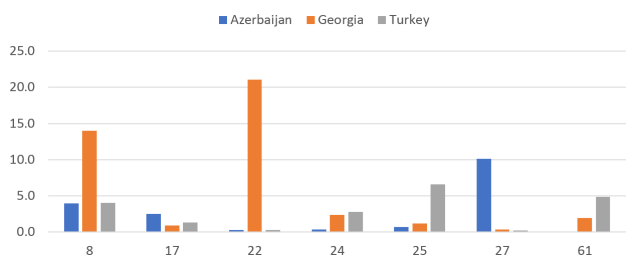
Source: UN Comtrade, Author’s own calculations
From the initial look, it is evident that Georgia is the clear leader in two categories: fruits/nuts and beverages. This comes as no surprise, as the country is renowned for its historical wine-making and also possesses suitable land resources for cultivation of different nuts. There are also two categories that Azerbaijan is in the lead: mineral fuels (surprise!) and sugars/sugar confectionery. Turkey, on the other hand, comes first in tobacco, salt/stone/cement and apparel production. Overall, out of the 30 product categories, Turkey tops in 21, Georgia in 6 and Azerbaijan in only 3 of them. Turkish dominance is observed in both heavy a and light industries (mostly). Even with a very limited sample of just three countries in 30 product categories, the effects of Dutch Disease in Azerbaijani economy are still apparent.
On the next graph, you can observe how Azerbaijan’s average RCA has varied over the years[1]. Between 2000 – 2004, the number is quite stable, hovering around 0.43 – 0.47. Although these numbers themselves are alarming, the situation was further exacerbated by 2008 when the average RCA reached 0.18. What might have caused this deterioration, in my opinion, is the oil boom that took place following the year of 2005, when the new pipeline, Baku – Tbilisi – Ceyhan (BTC) became operational (to this day, BTC is still responsible for majority of Azerbaijan’s crude oil exports). The colossal oil revenues effectively shadowed the non-oil sector. Suffering from lack of attention and sufficient investment, majority of the sector started to slowly decay and crumble. From that point forward, the average RCA has been on the rise, reaching the levels of 0.79 by 2016. Perhaps the subsequent reason is the change in policies after realizing the fact that a commodity based economy is never going to experience sustainable growth. Alternatively, one can also argue that, in reality, there is no define increase in average competitiveness, but rather the escalation is a product of the way we calculate the RCA indices, which would certainly be affected by significant plunges in oil price during 2009 and 2015 (the reason is, the oil price seriously alters the overall exports of Azerbaijan, which in turn changes the RCA indices for all product categories).
Graph 2: Timeline of Azerbaijan’s average RCA
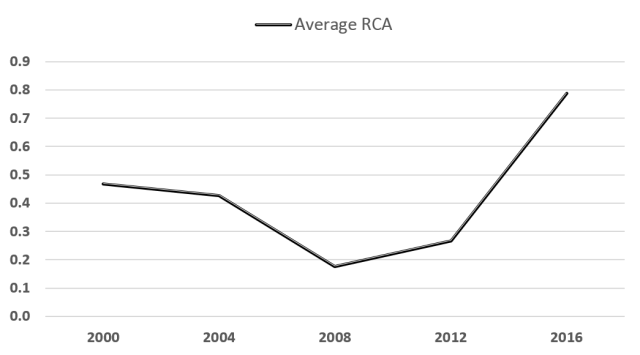
Source: UN Comtrade, Author’s own calculations
Lets now look specifically at the product categories given in Table 1, and their respective RCA indices for Azerbaijan in 2016. I have also provided the total World Exports of these products, which will be useful for our analysis later.
Table 2: Calculated RCA indices for Azerbaijan, 2016
| Code | Product Categories | World Exports – USD | RCA |
| 8 | Fruits and nuts, edible… | 105.3 billion | 3.9812 |
| 17 | Sugars and Sugar Confectionery | 42.9 billion | 2.4965 |
| 22 | Beverages, Spirits and Vinegar | 105.1 billion | 0.3065 |
| 24 | Tobacco and its Substitutes | 39.2 billion | 0.3904 |
| 25 | Salt; Sulphur; Earths; Stone… | 36.0 billion | 0.7231 |
| 27 | Mineral Fuels, Mineral Oils… | 1350 billion | 10.137 |
| 39 | Plastics and Articles thereof | 530.6 billion | 0.3208 |
| 52 | Cotton | 50.6 billion | 0.8228 |
| 61 | Apparel and Clothing Accessories… | 198.2 billion | 0.0062 |
| 76 | Aluminum and articles thereof | 152.6 billion | 1.1051 |
Source: UN Comtrade, Author’s own calculations
Compared to the rest of the world, Azerbaijan has comparative advantage in Fruits and Nuts, Sugars, Mineral Fuels and Aluminum products. Other categories, such as Cotton and Salt are potential prospects where we may be able to achieve the similar results in short period of time. If we are going to choose certain set of products in which we aim to specialize, I believe that we also need to keep the volume of international trade in mind. Because despite having promising RCA indices in Sugars and Cotton, we should n0ot forget that the total world exports in these categories is minuscule, with only 42.9 and 50.6 billion USD worth of exports during 2016. As much as specializing is a positive process, it does not always translate into compelling gains for the country. For example, in return for huge amount of effort and good policy needed to make Azerbaijan more competitive in Cotton production (for example), given that Azerbaijan succeeds in this cause and controls 1% of World Cotton Exports (in 2016, this number was 0.05%), our gain equals only 500 million USD, which is marginal even in terms of Azerbaijani economy.
On the other side of the spectrum, there are categories such as Mineral Fuels, Plastics, Apparel and Aluminum with gigantic levels of international trade. Our priority, without a doubt, should be to utilize our comparative advantage in these products rather than Sugars and Cotton which bears little importance in global trade. Thus, in my opinion, for the reasons which I will highlight below, Plastics, Apparel and Aluminum industries should be the utmost priority of Azerbaijan to exploit in order to diversify the economy away from Mineral Fuels.
Plastics and Aluminum production is dependent on the existence of certain natural resources. For the former, the input is crude oil, of which Azerbaijan has plenty of. For Aluminum, Azerbaijan primarily relies on alunite deposits in Dashkasan (Zaylik depository) rather than the most suitable resource for this purpose, which is Bauxite (Azerbaijan does have meager amounts of Bauxite reserves in Nakhchivan, but not sufficient enough for industrial production). Despite that, we still have a comparative advantage in Aluminum production, which can be further harnessed. Lastly, Apparel production, which tends to be very labor-intensive, also has potential in Azerbaijan due to the cheap labor, especially after the recent devaluations. Not only that, as much as Plastics and Aluminum production is capital intensive, the Apparel industry is the opposite. Thus, while the capital intensive categories can ensure a positive balance of payments for Azerbaijan, the labor intensive Apparel industry can provide employment for a large section of the population.
Conclusion
As far as the common sense goes, Azerbaijan should not have any hindrance with developing many of its non-oil sectors. Considering the computed RCA indices, availability of input products and the respective importance of the goods in international markets, particularly beneficial would be development of Plastics, Aluminum and Apparel sectors. While the former two can assist to maintain a positive trade balance of the country, the latter can boost employment.
Unfortunately, I do not have the sufficient practical knowledge of the procedure of attaining mining rights, environmental standards and etc. in Azerbaijan, but it is certain that a set of inclusive institutions (for protecting property rights, enforcing rule of law, providing security and so on) which incentivize the private sector and foster investment, along with a decent infrastructure are required for successfully utilizing the above mentioned sectors. Perhaps I can come back to this topic with more precise suggestions once I gain more knowledge in the future.
Footnotes
[1] Although this Average RCA does not truly reflect all 98 product categories (since I have only worked on 30 of them), the combined effect of the categories not involved in calculation is negligible, as they make up only 3.6% of Azerbaijan’s total exports.
