The Performance Index for the Budget Policy of Azerbaijan (PIBPA) is an index, developed and calculated by me on an annual basis. Its primary purpose is to quantify and grade my assessment of budgetary policy (in a broad sense) in Azerbaijan.
The index is calculated by using a quantitative evaluation which derives its value from eleven different indicators. Each year’s budgetary policy is then graded based on the quantitative results, as well as my qualitative assessment of the macroeconomic climate.
For the moment, the index is calculated for the years 2010 – 2020, considering the accessibility of data. Once the budget execution report for 2021 is available (likely in June), I will update the calculations. I plan to dedicate a separate page of the blog to PIBPA alone so that it is easier to reach.
To read the full paper, including the methodology in detail and my future plans for PIBPA, please see this PDF – Performance Index for the Budget Policy of Azerbaijan (PIBPA)
Results of the calculations, as well as my brief interpretation is given below.
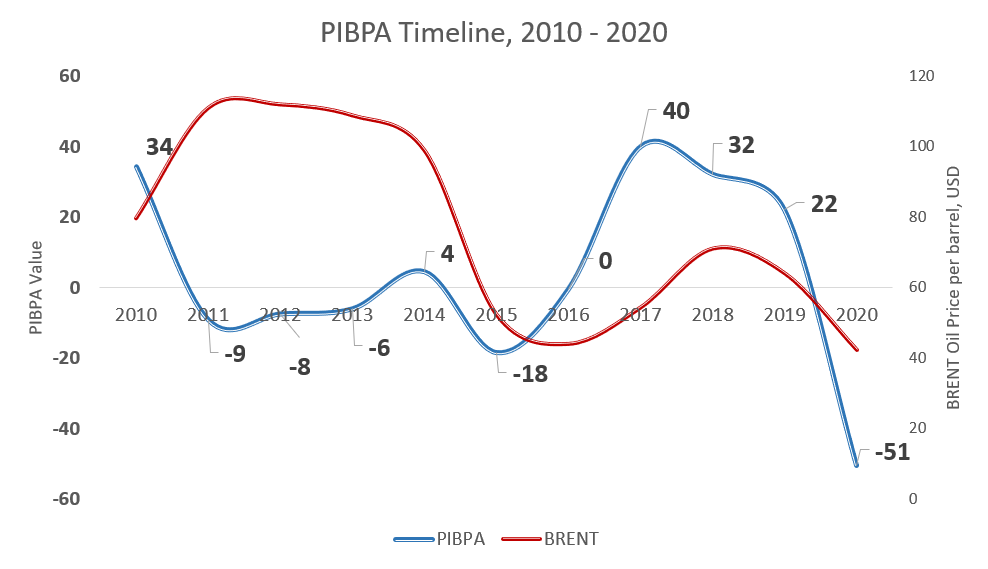
2010: A Decent Start
When compared to the years that came after, the year 2010 seems like a good point for Azerbaijan’s budgetary policymaking. Among the main positive things, we need to recognize the budget balance (surplus of 0.85% of GDP), low levels of foreign debt (only 7.4%), the acceptable level of public sector share in GDP (28%), sizable savings by SOFAZ (balance to assets = 37%) and small variation in executed figures (5.1%). As a result, the PIBPA score stands at 34. On the other hand, some problems, which will become more acute in the subsequent years, are already there: low non-oil revenues, growing construction spending, and large variation in the monthly distribution of budget execution.
2011 – 2014: Incompetent Budget-making
2011 – 2014 years can be considered the worst period of Azerbaijan’s budgetary policymaking and paved the ground for much of the country’s continued economic hardships. When the average price of BRENT crude oil was 108 USD per barrel in 2011 – 2014, instead of managing the windfall oil revenues responsibly, the government went on a rampant spending spree. Transfers from State Oil Fund to the budget hiked by 60% in 2011 alone (from 5.9 billion to 9 billion AZN). Economic growth was being fueled by double-digit real expenditure growth each year, mostly going to the extravagant infrastructure projects, and ever-increasing the share of the public sector in the economy. All these economic missteps inevitably set the stage for what was about to come.
One fact sums up the level of ineptitude in budget-making of these years: in the year 2011 when the price of crude oil peaked and averaged at 111 USD, Azerbaijan’s state budget had a deficit of 300 million AZN. By 2013, the Oil Fund was only saving 10% of its annual revenues (the same indicator was 51% in 2010), in defiance of historically high oil prices. Consequently, the PIBPA value dropped to -9 to -6 range durnig 2011 – 2013, and only improved marginally to 4 in 2014.
2015: The Collapse
2015 was a bitter year of truth for Azerbaijan. The State Oil Fund and the Central Bank could no longer support the overvalued national currency on the back of plunging oil prices and had to resort to devaluation. The results were severe. Cost-push inflation soared. Rising foreign debt, deficit in the state budget, and deficit in SOFAZ budget (for the first time in its existence) were just the beginning. The trauma of devaluation undermined economic confidence. Several banks collapsed, leaving the financial sector crippled, which only stabilized after government intervention. 2015 evidently demonstrated how the incompetent fiscal policy of the previous years made Azerbaijan exceedingly vulnerable to oil price fluctuations.
When we look at the PIBPA, we see that the value of 2015 is lower than the 2011 – 2014 period, but do not let that confuse you. Much of the negative developments of 2015 are due to years of accrued problems and unsustainable policies pursued in the previous years. The bubble was burst with the slumping oil prices in 2015.
2016 – 2017: A Hopeful Turn
With these troubles arising, the government announced plenty of plans, strategies, and road maps in 2016 to reverse the trend and ensure that no such thing happens again. The new strategies called for economic liberalization, increased transparency, heightened exports, less import dependency (especially in production), combatting oil reliance, and so on. This new sense of direction (although short-lived) certainly affected the budgetary policy positively, and consequently rose the PIBPA of 2016. The budget deficit got smaller, the share of SOFAZ transfers decreased down to 43%, construction expenditures experienced their lowest point since the oil boom at 15% of total expenditures, the State Oil Fund’s budget had a small surplus (despite low oil prices), and non-oil revenues were on the rise. Due to all these developments, Azerbaijan’s PIBPA rebounded from -18 to 0. Note that even with all these, two problems remained. First, the monthly distribution of executed budget was once again heavily skewed towards the end of the year. Secondly, the GDP growth forecasts of the Ministry of Economy turned out to be extremely wrong (3.4% growth forecast vs -3.1% actual).
The year 2017 was an exceptional year for Azerbaijan’s fiscal policy. Building on the progressive developments of 2016, the Ministry of Finance announced that the country would follow a tight monetary and fiscal policy. The budget project ambitiously called for steadily declining SOFAZ transfers year-by-year, constraining the foreign state debt (particularly those obtained by State-Owned Enterprises), and adopting a new economic model that instead of state investment, relied on the private non-oil sector for growth. The transfers from SOFAZ decreased by 20% compared to 2016, the largest decline ever. The revenues and expenditures of the budget were set to be reduced by 9% and 6.5%. Construction spending was unchanged from its low levels in 2016. The monthly distribution of expenditures and revenues were far more equally distributed, with an average standard deviation of only 1.4% (for reference, it was 5.1% in 2016). As a corollary of all these improvements, the Performance Index had the biggest jump and reached the maximum value of the period that I analyzed – 40.
In spite of all these positive steps, the government backtracked on its policy of fiscal consolidation. Despite arguing in 2017 that this policy would continue for 3 more years (Budget Project 2017, Page 9), it got “canceled” in mid-2017 when the budget was amended. With the revision, the government went back to its previous unsustainable policies. Numbers did not vary much with the amendments in 2017 (expenditures were heightened by 5.4%), but the rhetoric was completely reversed. It signaled that the next year’s budget will not be built upon principles of fiscal consolidation. According to my alternative calculations, the PIBPA index for 2017 could have been as high as 49 if the government did not amend the budget in June.
2018 – 2019: There and Back Again
With the rising oil prices in late 2017, all the road maps, strategic plans, decreasing transfers, and the talks of tight fiscal policy got abandoned. Instead, the new budget included a massive surge in revenues (36% increase, fueled by SOFAZ transfers) and expenditures (29.2% increase). The transfers from SOFAZ in 2018 were 80% higher, reaching 10.9 billion from its previous 6.1 billion AZN. Construction spending almost doubled in a single year. The share of non-oil revenues declined. It was now clear that the Azerbaijani government went back to its old and injurious habits only two years after the oil crash and devaluations of 2015. This new direction in 2018 frustrated me so much that it persuaded me to start my blog and write my first-ever post on the subject (which shares the same name as this section – “There and Back Again”). In contempt of having the third-highest PIBPA value of 32, from the perspective of budgetary policy, I regard 2018 as a negative year, as it retraced some of the “gains” made in 2017.
The budgetary policymaking was not modified much in the year 2019 compared to 2018 and continued its downward trend. Thanks to steadily increasing budget expenditures, the public sector share in the total economy once again reached 30% for the first time since the devaluations. The monthly distribution of budget execution, which improved extensively in 2017, started to roll back and reached its pre-devaluation values. Transfers from SOFAZ rose by 7%. Construction expenditures rose by 22.5% and reached their all-time high of 6.2 billion AZN (for reference, this amount is equal to the spending for Education, Healthcare, Social Protection, and Agriculture in 2019 combined). The few positive things in this year, primarily the rising non-oil revenues, were not enough to compensate for all the adverse developments and as such, the PIBPA value continued to bleed and reached 22.
2020 – The Pandemic
The year 2020 would prove to be one that will be long remembered for the world, as we started battling the still-ongoing coronavirus pandemic. The virus deteriorated the economic indicators of all countries. Coupled with the historically low oil prices, the effect of coronavirus on Azerbaijan was severe.
The executed budget of 2020 had a deficit of 2.39% of GDP. To compensate for the lost revenues from the non-oil sector, the government heightened the SOFAZ transfers to 12.2 billion AZN. In spite of the 8.2% hike in government expenditures, the GDP of Azerbaijan shrank by 4.3%. Naturally, all these factors undermined Azerbaijan’s budgetary performance. Indicators such as budget balance to GDP (due to rising deficit and shrinking GDP), non-oil revenues to essential expenditures (due to declined non-oil revenues), public sector share in GDP (due to rising expenditures and shrinking GDP), and SOFAZ balance to assets (due to historically low oil prices) all understandably slumped. One declining indicator that I struggle to explain is the monthly distribution of budget execution. Interestingly, the standard deviation reached its second-highest point (2.9%) since 2011, giving us clues of the vast inefficiency of expenditures once again.
Because of all the factors mentioned above, the PIBPA in 2020 fell to its lowest point of -51. Nonetheless, we should not interpret this number on its face value, but rather consider the extraordinary economic circumstances that led to it. Surely the government could have taken some steps to reduce the decline in PIBPA (such as ensuring more efficiency of spending and hence improving the monthly distribution indicator), but the fall was inevitable, given the global macroeconomic climate of the time.
2021 and Onward
The year 2021 will be an interesting one to judge once the information on budget execution is made available. The recovering oil prices and the initial economic shock of the pandemic being gone will surely affect various indicators positively. On the other hand, it is hard to forecast what will happen to most of the indicators as they heavily depend on the actions of the government.
The year 2020 once again demonstrated how dangerous reliance on oil is. Similar to the immediate years after the 2015 oil crash, we can expect certain improvements in 2021. If the government has learned its lesson, it will not repeat the same mistakes that it did in 2018 – 2019. On the other hand, we have seen that the Azerbaijani government switches to unsustainable practices as soon as oil prices recover. Thus, the strong rebound of oil prices in 2021, and their continued bullish outlook eminently jeopardize the likelihood of responsible policy action.
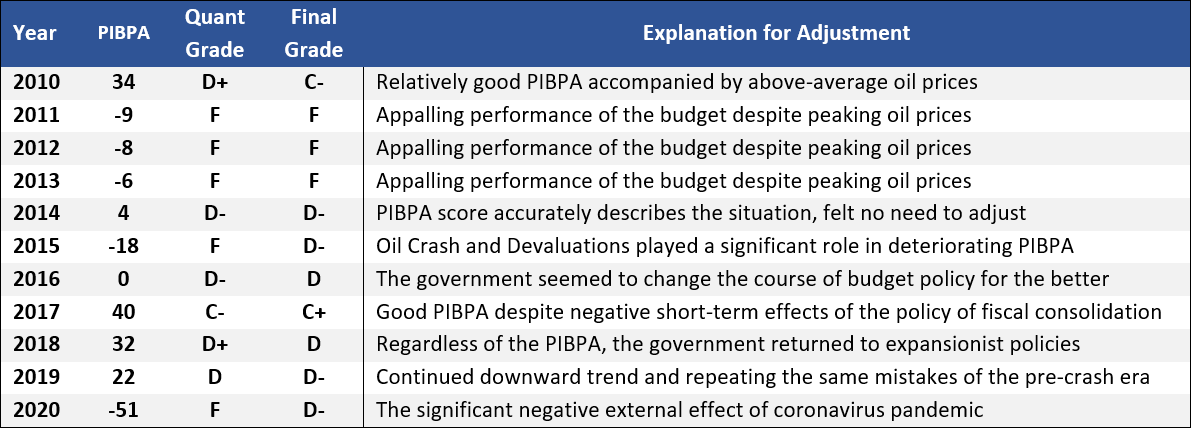
Final Grades
Considering the analysis above, I decided to make appropriate adjustments to the grades of each year. To limit my direct influence here, I only moved the final grade by one unit in either direction at maximum. For example, if the quantitative analysis yields a C-, at maximum I can alter it to D- or B-. You can see the grades from the table below:
For any questions, please check the full paper – Performance Index for the Budget Policy of Azerbaijan (PIBPA). If you still have questions, or want to give suggestions, do not hesitate to contact me using the contact page on the blog, or by commenting below.
